Analyzing against market via the percentiles that best represent your compensation philosophy is an important part of annual benchmarking processes and ongoing data review. Additionally, for many organizations, competitiveness is viewed differently depending on the job family and/or level (e.g., G&A roles at p50 vs. AI/ML Engineering at p75).
To that end, Offers allows users to set, and change, their display percentiles based on individual preferences.
Getting Started
Navigate to the market data table within any Job Family data view.
To change the market data displayed in the table, click on p25 and/or p75 to change the lower and/or upper bounds in the corresponding dropdown. Users can choose 5% increments between 10-45% and 55-90%. (Note: there is not an option to change the p50 - it will always remain static.)
After lower and/or upper bounds have been selected, the table will update and market data at requested percentiles will be visible.
Comparing against your data
Once market data lower and/or upper percentile bounds have been set, users can choose which they would like used as the point of comparison between their offer data and that of the market.
Click on the p50 to choose the appropriate comparison point. Note, the percentiles available in the dropdown will be specific to those set on the market data side.
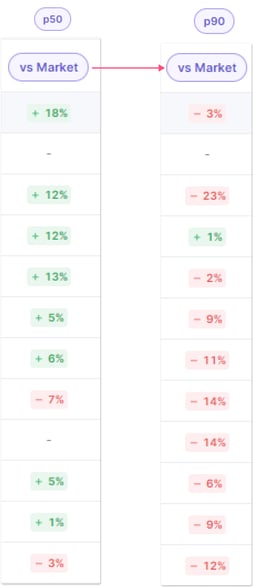
Once the comparator is selected, the Market Percentile or vs. Market calculation will update accordingly.
Downloads
Remember: whatever is currently visible on screen - including filters and percentiles - is what will be included in downloads. Percentiles in each download - whether market offers or your company's offers - will be governed by your selections at the top of the market table.
Questions, comments and feedback are always welcome. Live chat in app or email us!